
0:39:49
Code Review Skills for Pythonistas by Nina Zakharenko
Published November 8, 2018
This video features Nina Zakharenko at DjangoCon US 2019 in San Diego, California, USA.
DjangoCon 2019 - Goodbye Print, Hello Debugger! by Nina Zakharenko
Still debugging your code by using print? Learn how to level up your ability to troubleshoot complex code situations by using the power of a fully-featured debugger in this talk aimed at all levels of programming ability.
This talk was presented at: https://2019.djangocon.us/talks/goodbye-print-hello-debugger/
LINKS:
Follow Nina Zakharenko 👇
On Twitter: https://twitter.com/nnja
Official homepage: https://nnja.io
Follow DjangCon US 👇
https://twitter.com/djangocon
Follow DEFNA 👇
https://twitter.com/defnado
https://www.defna.org/
Intro music: "This Is How We Quirk It" by Avocado Junkie.
Video production by Confreaks TV.
Captions by White Coat Captioning.
Nina Zakharenko argues that Python debuggers are more effective than scattered print statements because they expose a program’s execution state, variables, call arguments, and data structures directly at a breakpoint. She demonstrates Python 3.7’s `breakpoint()`, PDB, IPDB, Visual Studio Code’s debugger, and Jupyter notebook debugging, covering stepping, inspecting values, watches, autocomplete, and interactive REPLs. She recommends IPDB for command-line work and IDE debugging for larger codebases or templates, and advises using pre-commit hooks to prevent debugger statements from reaching production.
Summarised automatically from the transcript.
Automatically transcribed, so expect mistakes in names and technical terms.
All right. Um hi DjingoCon. Hi. Hi. Good evening. My name is Nina, and I'm so glad to be back here. JingoCon was the first conference that I ever spoke at. back in 2014, so it's always really good to be back. Now a quick show of hands, and this is a no-judgment zone. When you run into a bug in your code, um A bug that needs a little bit of investigating. How many of you use print to debug your code? Okay, almost everyone. You're in the right place. How many of you use PDB or IPDB? Okay, quite a few, maybe 40%.
And how many of you use the debugger in your IDE? Okay, only a small handful. Okay, so everyone in the room is gonna learn something new today. Because I'm gonna talk to you about the benefits of using debuggers when programming in Python, I'm gonna show you a few different types of them. And the slides are going to be available after because there are plenty of additional resources throughout this talk. You can just download the slides to follow the links. They're available at nina. to slash DjangoCon 2019. And if you want to try something a little fun in this talk, if you're learning something new, you can share a tweet, use the hashtag DjangoCon, and if you'd like, you can tag me at NNJA on Twitter.
A little bit about me. I work at Microsoft as a Python Cloud Developer Advocate where I focus on making Azure and Python. for VS Code, easier to use for developers everywhere. And that's the cute mascot for our team, Bit. If you think Bit is cute, please find me in the hallway after first sticker. I might even have some cliffy stickers to share. They're contrabands. I've written software for over a decade at companies like Meetup, Reddit, HBO. I've worked on projects big and small in a wide variety of organizations Now, if you're already using prints, you might be wondering, well, what's the point of debuggers at all?
The problem with print is that it doesn't give us a lot of context. If you put prints in your code, you're probably familiar with the process of tweaking while you're printing it out because you got it wrong, adding something, rerunning the code. Tweaking your formatting, rerunning it again. Sometimes the bug is in your print statement. Right? I think we've all been there. You're just, you know, so angry. Um it's tedious. It's really tedious. So I'm going to show you a little demo application. It's a very simple Flask app. There's no data store. All it does is it searches the GitHub API for popular libraries by stars based on a language. And that API data comes back as JSON. Pretty standard stuff.
The meat of the code looks like this. There's a method called repos with most stars. We generate a query that we'd like to send to the API. We pass in a few parameters, the query, the sort that we'd like, the order, and then we get back a response. And then we do something with that JSON. Okay, so let's check out what that looks like. All right, can everyone uh see this? Maybe it's a little bit too big. How about now? Okay.
Let's do uh yeah, okay. Let's do one more down. So this is my repos with most stars method. Um here I'm creating my query, have my parameters. Um Getting back a status code and parsing these items here. I'm going to take that out for the minute. So let's say I wanted to troubleshoot something with items. I can Yeah, print them out like that and then I can Run my Flask server here. And this is my application that we were looking at before. I can select and deselect languages and submit
and see what the Python popular Python GitHub repositories are by number of stars. And if I go back to my Flask project, that was the output of my print , which, you know, kind of sucks. It's gonna take me a lot of work to make something useful out of this. Now, if you're using uh Python 3. 7 and up, there's something new called the breakpoint method. So all you would have to do is take out your print and put in this breakpoint instead for Python 3. 7 and up. If you save that now. And I'm going to go back and run my Flask server. And down here, I'm just going to use curl to hit that web page so I don't have to go back and keep clicking on it
Now what this has done is it's hit that breakpoint. We're now on the line after that breakpoint was inserted. And we can do some really cool stuff here. The most important thing here is that items That JSON, that list of uh dictionaries that represents the JSON I got back from the API, it's just uh available here in this prompt. Kind of like the Python REPL but not exactly the same. So I can check out the length of it. I can get one item and you know take a look at The key is it's a lot easier for me to just
really quickly get more information about my that my objects, my state. I can even, let's say the list of items is really long, you know, I can very easily take a slice and just work with that subset of data. The other thing that I can do in this special PDB prompt is called interact mode. So when I enter interact mode, we see these three arrows, and that signifies that now we're in a Python prompt. So I have access to all of the same objects that I did in PDB, just a little bit more powerful. So I can hit Ctrl D to exit
the interact mode and then control D again to exit the debugger or I could do uh C to continue. So Print. Kind of sad, right? Working with JSON especially I find can be really annoying. Sometimes data just doesn't look how you expect it to. Other times you have a large nested data structure. And when you're kind of fighting your tools, when you're using print to get state about your program
, it's just going to take you a lot more time because a debugger helps you examine the state of a running program. With a debugger, you're using a tool that's made for the job. A debugger is going to drop you into the point of execution. And it's going to allow you to see not just the string representation of whatever it is that you're trying to look at, but actually allow you to call it to examine the arguments given to a function, to examine other values and variables in that scope, and a lot more. You can even write new snippets of code and experiment to your heart's content and pull out that code afterwards and save it. That's a workflow that I do pretty regularly.
And I feel like a lot of folks that are starting out in Python are just afraid to use debuggers. It seems like there's too much overhead and using print is just so familiar, but I hope to show you that there is nothing to be afraid of. When you're using debuggers, you can get started with them in no time at all. It's really gonna supercharge the way that you write code, the way that you find bugs, and you won't have to clean up prints littered all over your code base as you're examining the state of multiple objects. I feel that once I gave up using print to debug my code, my productivity as a programmer really increased. And yours can too. So I showed you the debugger. That was a little bit better than print, right?
And adding that debugger breakpoint wasn't that hard. Just remember that's for Python 3. 7. I'll go over what you can do for other versions later. You can do all sorts of stuff in that console. You can call vars to see the variables in your scope. You can call dir on any of the objects to see the methods available. You can pretty print. etc. You can also move around the code base, and I'll show you that in quite uh in a little bit What you're going to learn today from this talk, I'm going to cover why you should use debuggers. I'm going to talk about breakpoints and other fundamentals. I'm going to talk about my workflow, the tools that are available, like PDB, IPDB, IDEs.
Breakpoint in Python 3. 7. I'm going to show you demos, tips, tricks, and a little bit of guidance on when to use what. Quick disclaimer here, this is my way. These are there are many tools and many workflows available for debugging, but I'm going to show you the workflow that I use It doesn't mean that it's the right one, so choose what's best for you. Now there are a few different types of debuggers. For CLI, PDB is included in the standard library. It's a great option, it's portable, you don't need to install anything else, but I tend to use IPDB, which is installable via pip. Just pip install
IPDB. And IPDB has all the nice features of iPython, like syntax highlighting, better tab completion. That's what I'm going to show you today. And so a CLI debugger might look something like this. Now, if you're not comfortable on the command line or you prefer graphical tools, there are still plenty of options available. There's PUDB, which is a graphical CLI tool. There are many IDEs available. I use Visual Studio Code, but there's also PyCharm and many others. I'm going to be showing VS Code today. It's what I use for my daily editor. And debugging in VS Code might look something like this.
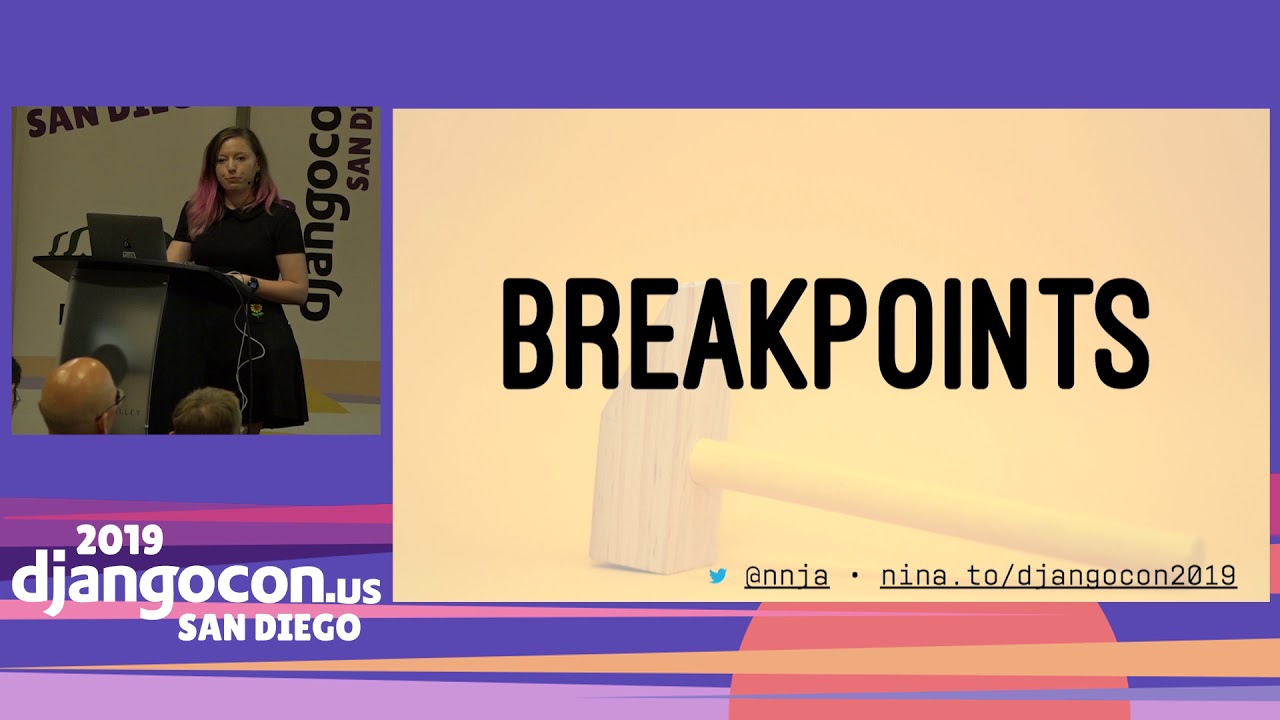
The foundation of either of these methods of debugging is the breakpoint. A breakpoint is kind of like a trap. Imagine that your program and you're walking along, you're executing code line by line, and then you trip on something and fall into a hole and you need to stop. That's a break point. It's going to stop the flow of execution in your program temporarily. Now, Python 3. 7, use breakpoint. Why? What are the advantages? Well, I prefer using IPDB. IPDB is a third-party package. It's not in the standard library. With Breakpoint, you can set your debugger of choice really easily.
All you need to do is export this environment variable. It offers, you know, IPDB offers syntax highlighting and all those nice things. And but I can change it later if I feel like it. I can switch it out in the future. Maybe something new and better and shinier will come along. I don't have to change my workflow. So that's one great reason for upgrading. Another great reason is there's an environment variable that allows you to skip any breakpoints at execution, for example in production. I'm going to talk about why that's later a little bit or why that's important a little bit later on. Now, if you're using a version of Python that's less than 3. 7 , There are other ways to add breakpoints.
You can uh go the first route and add them directly to your code. For PDB, just import PDB, use a semicolon for same line, and then pdb. set trace, or for IPdb, just add an I to both places. And the second option is that you can add them interactively. So for those of you who are in Dan's talk earlier today about um Setting up a containerized development environment in VS Code, he showed you that you can run PDB as a module with a dash M flag. And then you can interactively Add in where you want breakpoints to be. Now I'm not going to cover that approach. There are pros and cons to either.
With option one, it's harder to disable. With option two, if your code uh moves around your breakpoint line numbers might change. I use the first approach exclusively, but to each their own. There are five really important commands that you should remember when using the debugger because you can learn more about the tool as you use it. You can always um get more complex, more complicated, but this is really the foundational the list of foundational things. The first is L for list or LL for long list, that's gonna print out all of the code around the breakpoint that was hit. N uh is go to next line.
S is step into. So if there's a method being called enter it. Otherwise just go to the next line. C is for continue to the next breakpoint or until the program completes. And then H is for help with an optional command. If you forget what the commands are It's uh there's documentation available right there in the tool. And there are tons of other useful commands like R for return that jumps to the return statement for the current function in execution. So that's useful if there are multiple return statements. J will jump to a line. It's going to help you break out of a loop or skip long chunks of code without having to continue repeatedly. But you really can be fully productive by starting with the basic commands and adding on things as you need them.
This cheat sheet is available to download at the same link as the slides. And yes, my cheat sheets match my hair. So let's take a look at what some of these things look like. Okay, so We saw what PDB looked like before. Let's look at that again, one more time. So PDB, black and white, I have an arrow here in my prompt. That's not exactly what I'm looking for. I'd rather use IPDB.
And to do that All I need to do is set an environment variable called Python Breakpoint to the method that I want called as my breakput function. Here it's ipdb. setTrace. Now once I do that and I hit my debugger again, ooh, ah, fancy colors. Right, this looks a lot nicer. So I'm going to move my breakpoint to the top of my method and Let's look around a bit.
So I've moved it right after the repos with most stars definition. I'm just going to clean up the space here. Okay. Now, um let's say I wanted to know how this query was getting being created. I could step into this method. So remember I could type step the long form commands, but once you use this for like 30 minutes, you'll remember the shortcuts. So I'm going to do S for step into. That has now put me into the create query method. I can type A for args To find out what arguments were passed into this function.
Here are the languages and here are the minimum amount of stars on GitHub. I can hit next to go to the next line L will print out all the lines around my breakpoint for a little bit more context. Now something important to note here. I'm currently on line 19. If I type in query here, if I try to look at that query object, I'm going to get a name error that query is not defined. I still do this all the time. And what you need to do here is just step to the next line, and now query is defined in context. Cool. So I'm going to jump to R for return. And I can take a look at my query now.
This is what's going to get returned from this function. And I can hit next and that will pop me back up the stack into my cre uh out from my create query method into the repos with most stars method. Now I'm just going to continue on for a little bit. Let's say I use long line to get more context. I want to jump to after items are defined. So that would be line 38. Now let's say I have a bunch of items and I don't remember what um how to how to access the key for the amount of stars in a repository. So I can, oops, there we go.
Sorry, a blank line doesn't kind of count in this context. What's going on here? What's that? Oh I d I didn't run the lines right. Um let me continue and then start that over again. Oops, sorry. So let me just uh go through this code with next and make sure that I get my response JSON this time. And now I should have my items available. Okay, great. Pair
program debugging. My favorite. Okay, so let's get an item here And I can look at the keys. This is still quite a bit of work, but the nice thing about IPDB is I can do an opening bracket here and a quote and then I can tab complete. So I know that the key is called star something. Now if I tab that it'll give me all the options. I think this stargazers count must be some weird legacy GitHub code. Maybe that's what it used to be called. But it does make the API a little bit harder to use. With autocomplete, it's a lot easier.
So that's debugging on the command line. What does debugging look like in an IDE? I'm going to remove this line. And this is Visual Studio Code. In order to get the best experience in Python with Visual Studio Code, you're going to want to make sure to download the Python extension. There are links to that in my slides. To set breakpoints in this IDE, in most IDEs, you're going to look at something called the gutter. The gutter is on the left side here, left side of the line numbers. And if you click on it, you
should see a red dot. Now to access the debugger, you're going to click on this icon that's a bug with an X on it, you know, no bugs. Very clear icon. I like it. And you're going to want to look in this drop-down here. If you don't have any debugger configurations, maybe you're running the debugger for the first time, you're going to want to add a configuration. And then make sure you have flasks selected. And to start the debugger, you can just hit play right here And you'll see that my this bar at the bottom, it's changed color to let me know that I'm in an active debugging session Now, if I wanted to look at my website, something I really like about VS Code is I can command click to follow links
uh really useful for logs and things like that. And I'll see this um yellow arrow here on line 25 That is where my current line of execution. Something that's really nice about the visual debugger is I can mouse over variables here to take a look at what the values might be. I also have access to a very easy watch. So um the watch will Is a place where I can put variables that I'm kind of really interested in and they will always appear on the left-hand side. There's also a nice debugging console here. on the bottom to the left of terminal. Um it has uh
um oops tab tab complete and uh oops What is going on here? I think I accidentally uh killed that. Let's try again. I'm pretty sure I have the butterfly Mac keyboard and I'm pretty sure that there's like a stock key because uh sometimes I get just random key presses. All right. So jumping over that, looking in my debug console, I can now take a look at query , etc. It's also Really nice for being able to quickly, if I go back to the debug panel and I look at breakpoints here, I can easily check or uncheck breakpoints.
So I'm going to uncheck the one that's in my API. pui. I'm going to check the one that's in index. html. And now if I hit play to continue debugging, I'm going to stop at my breakpoint in the template. And I can now mouse over these and see what the values are. So for those of you who have worked on templates in the past, you know how painful, how incredibly painful this process can be. So this is probably one of my favorite features of IDE debugging. All right.
Now, here's the link for downloading VS Code, installing the Python extension, instructions for creating a debugger configuration. You notice that I might have been clicking on those visual breakpoints, those icons. Those icons correlate to um The same commands that you used on the CLI, C for continue, that kind of play arrow, the arrow with kind of the jump over, that's n for next, etc. kind of have a handy guide here. Now, when are you going to want to use what? There are a lot of options. How do you know when you want to use what tool? I rarely use PDB. I find the functionality too limited. But my personal preference for CLI, I use CLI debugging for most small programs and scripts
using IPDB because sometimes I just I want to work from the command line, that's where I'm most productive. I tend to reach for ID debugging when I'm working with a large or complex code base. or if I want to dive in and debug templates, but choose the strategy that works best for you. Now a few tips and tricks I wanted to share with you. A simple one. This one took me a long time to figure out. I've spent a lot of time on my debuggering pr debugger pressing N for next or pressing S for step and two. If you just hit return, it will rerun the last command. You all know how important unit tests are, right? If you ever get stuck figuring out why a unit test is failing, throw a breakpoint in there.
I do that all the time. It's really handy. And this is one of my favorite hacks. See if I have time for a demo at the end. But I showed you Interact in the beginning. The interact command dropped me into a Python REPL where I have access to all the variables and all the state. You can make a. pdbrc file. It's a configuration file. And this specific configuration will allow you to add a new alias, a new command called interact i. uh that you can run to get an interactive IPython REPL in your debugger, which is really nice. There's a lot of uh handy
methods in iPython like cPaste, which allows you to paste multiple lines of code while uh r retaining uh indentation. So that is really, really useful. There is a link to download that at nina. to slash pdbrc And there's now new debugging in Jupyter Notebooks in VS Code. I want to show you that real quick. So if you open a notebook, you should see a button here, debug cell, and if you hit that, it will start a debugger session in your notebook. You'll see that yellow line show up
once my computer decides to stop thinking about it. There we go And you can step over just like you did with your other code. You can you know mouse over here for more information. And if I play that, we'll see. my output here from this little example notebook. So for those of you who do a lot of Jupyter notebooks, you know how time-saving this can be. Now a few gotchas, you don't want to leave breakpoints in production code. It could halt your whole running program. You don't want to be responsible for that. So even if you're using Breakpoint in Python 3. 7, it's still best practice to not commit code with breakpoints in it at all.
A tip for that is using git pre-commit hooks. Pre -commit hooks will prevent a commit that matches a particular condition. And that sounds really hard, right? But thankfully there's a library out there that does it for you. pre you can uh see uh pre-dash commit. com it's written in python just run pip uh install pre-dash commit and it comes with a hook that does the smart thing the debug dash statements hook And it doesn't just check for keywords in a file. It uses the AST module to check for imports and check for debug statements, no matter which debugger you use. So breakpoint, PDB, IPDB, it catches it all. And it's going to be a lot easier to feature-proof as Python the language grows.
So set up those pre-commit hooks to Look for debugger statements. You can also use them to run a linter to check for trailing whitespace, unused imports, etc. Now, just to wrap up, by now you should have a basic understanding of how debugging works in Python, as well as the tools available from PDB in the standard library to graphical debuggers and IDEs. And you should know that fixing bugs is a process of confirming one by one that the things you believe to be true about the code are true. And when you find an assumption that isn't, you found a clue. Your debugger is the best tool that you can use for this. And I hope I've given you the confidence to say goodbye to print and hello to the debugger.
I've included a few additional resources in the slides. And thank you all so much. Please download the slides. If you want to learn more about Python at Microsoft for additional resources, you can also check out aka. ms slash DjangoCon 2019, follow me on Twitter, and thank you so much.
At a breakpoint, you can inspect objects and variables, check their lengths or slices, call methods such as `dir` and `vars`, and enter an interactive Python session with access to the current program state.
Discussed at 5:45A debugger shows the running program’s execution point, variables, function arguments, and other state directly, without repeatedly editing print statements or cleaning them up afterward. It also lets you experiment with code in the current context.
Discussed at 8:03Replace a debugging print with `breakpoint()`. You can configure which debugger it invokes through the `PYTHONBREAKPOINT` environment variable, for example to use `ipdb.set_trace`, and you can disable breakpoints through an environment setting when needed.
Discussed at 11:54Import `pdb` and call `pdb.set_trace()`, or use `ipdb.set_trace()` after installing IPDB. You can also run PDB as a module and add breakpoints interactively.
Discussed at 13:28Use `l` or `ll` to list nearby code, `n` for the next line, `s` to step into a function, `c` to continue, and `h` for help. Other useful commands include `r` to run to the current function’s return and `j` to jump to a line.
Discussed at 14:14Install the Python extension, add a breakpoint by clicking in the editor gutter, create a Flask debugger configuration, and start it with the play button. VS Code then provides the current execution line, variable inspection, watches, a debug console, and easy breakpoint toggling.
Discussed at 21:16Nina uses IPDB for most small programs and scripts because it provides a productive command-line experience. She prefers IDE debugging for large or complex codebases and for inspecting templates, while PDB is a portable standard-library option with fewer features.
Discussed at 25:14Use a pre-commit hook, such as the `debug-statements` hook provided by the `pre-commit` package. It uses Python’s AST to detect `breakpoint`, PDB, IPDB, and similar debugging statements before a commit is accepted.
Discussed at 28:49Note: We understand that names change, people change, and bodies change. We respect each individual's journey and privacy. If you have any concerns about a video or need us to remove content, please don't hesitate to contact us. We will handle your request with care and promptly address any issues.

Published July 15, 2026

Published July 15, 2026

Published July 15, 2026

Published July 15, 2026

Published July 15, 2026

Published July 14, 2026
